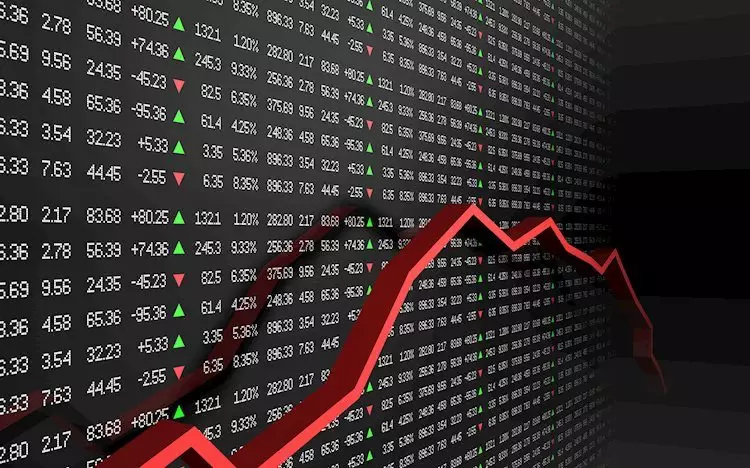
The US stock market has seen an unprecedented Bull run over several years, but numerous indicators suggest that this phase might be nearing its conclusion. With references drawn from the movements of the US30, US500, and US100 indices, the market’s trajectory raises critical questions about whether current patterns signal a continuation of the upward trend or a formidable reversal. This article dissects the recent price actions within the indices, investigating key historical parallels that might provide insight into the future.
Recent analytical charts suggest that all three indices—the Dow Jones Industrial Average (US30), the S&P 500 (US500), and the Nasdaq 100 (US100)—exhibit strikingly similar behavioral patterns. This synchronization points to collective momentum shifts which can be pivotal indicators for traders and investors. The US30, for instance, has recently faced considerable resistance after an attempt to breach its long-term price channel, which has remained stable since 2020. This struggle to ascend signifies underlying weakness, especially given the sharp decline of over 6% after a failed rally.
While a slight recovery—around 3%—is notable, the index’s current position near the psychological resistance level of 43,180 could be critical. Observing past corrections could serve as a valuable tool in forecasting potential movements. Most notably, in early 2022, the US30 witnessed a significant pullback similar to what it is currently experiencing, preceding a substantial Bull run. The parallelism between these two moments invites speculation regarding whether the historical trend will repeat, or whether it will diverge into an unforeseen market landscape.
Examining the US500 reveals a similar narrative, marked by its own significant correction that resulted in a drop exceeding 20% during a ten-month span. Following this, the ensuing two-year Bull run mirrored the recent market trends, underscoring the cyclical nature inherent in stock market movements. As investors, understanding these patterns is crucial; what appears as mere statistics can provide deep insight into potential future price actions.
Given that the current cycle closely resembles the critical transition seen between 2020 and 2022, there is substantial merit in watching for indications that might suggest an impending transition phase. These turning points could present both risks and opportunities, warranting a diligent approach toward assessing market behavior. The levels at which the US500 trades are paramount; careful monitoring will reveal whether a breakout or a breakdown emerges as we move forward.
Turning to the tech-heavy US100, one can find further corroboration of this reflexive market behavior. The index too experienced a tremendous upward trajectory from 2020 to 2022, followed by a considerable retraction—over 30%—which fundamentally reshaped market sentiment at the end of 2022. The cyclical rhythm here is consistent with the dynamics observed in broader indices, making it essential for market participants to be cognizant of this behavior.
Currently, the Nasdaq 100 indices show promise of maintaining an upward path, provided it can sustain levels above significant support at 21,487. Observations indicate that it may approach a retest at the resistance level of 22,010 by late 2024, depending heavily on the market’s overall sentiment. The ability of the index to hold or break through these critical benchmarks will be instrumental in shaping the outlook for the broader stock market.
As we venture into this potentially pivotal phase of the Bull run, it is vital for investors and traders to remain vigilant. Striking a balance between caution and opportunism is key. Here are some strategic actions to consider:
1. **Vigilance on Key Levels**: Focus on critical resistance and support zones across the indices, especially the US30 and US100.
2. **Multi-Timeframe Analysis**: Engage in an in-depth analysis of price behavior across various timeframes—daily, weekly, and monthly—enabling informed trading decisions.
3. **Preparation and Adaptation**: Flexibility in strategy is essential; being prepared to exploit opportunities as they arise will likely yield better trading outcomes in a shifting market landscape.
While patterns in the stock market can serve as reliable indicators, they should be approached with a sense of caution. The indicators suggest that we may be nearing the final stretch of this Bull run. The interplay of history and present market dynamics compels traders to engage actively with the unfolding narrative, remaining agile in the face of potential changes ahead.